Medicare Enrollment Charts
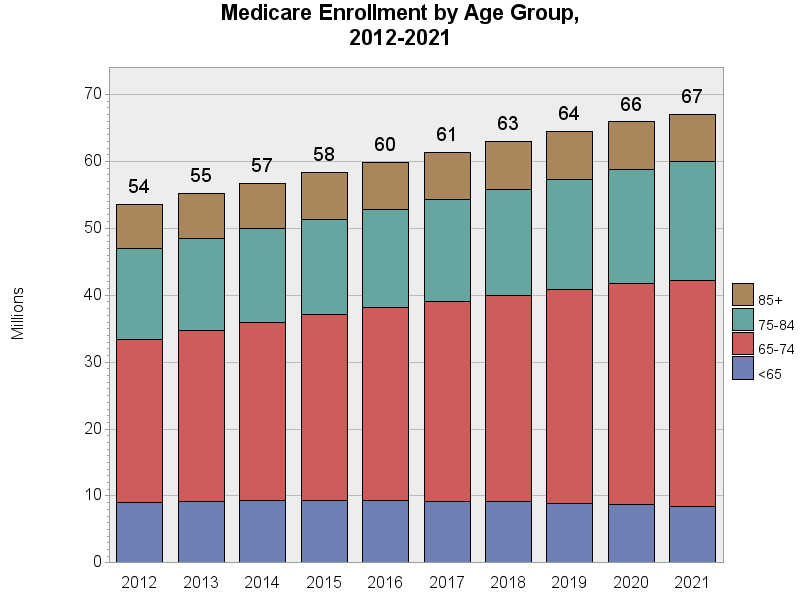
Medicare Enrollment by Age Group, 2012–2021
Description:
The number of people enrolled in Medicare has increased gradually over time. There were 53.5 million beneficiaries in 2012 and 67 million beneficiaries in 2021. The age distribution of the population has remained stable over time.
Technical Notes:
Counts include all Medicare beneficiaries who were enrolled in Medicare on or after January 1 of the year.
Age is calculated based on the age of the Medicare beneficiary as of December 31. If the beneficiary expired, the age is calculated based on age at time of death.
Chart Date: April 2023
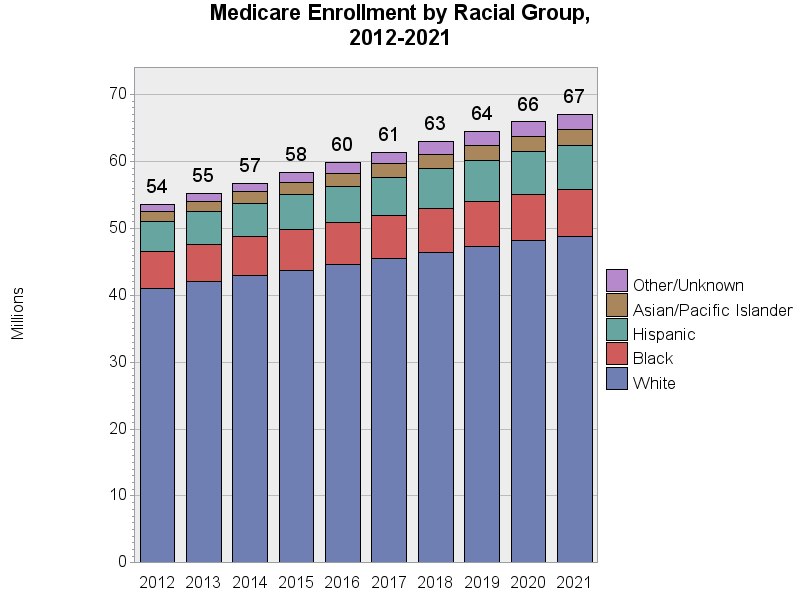
Medicare Enrollment by Racial Group, 2012–2021
Description:
The racial distribution of Medicare beneficiaries has changed very little over time. There are proportionately fewer whites in 2021 compared to 2012 (72.7% versus 76.6%, respectively); there are more Asian/Pacific Islanders (3.7% versus 2.8%) and Hispanic beneficiaries (9.8% versus 8.5%).
Technical Notes:
Counts include all Medicare beneficiaries who were enrolled in Medicare on or after January 1 of the year.
American Indian, Native American, Other, and Unknown races are grouped together due to small cell sizes. The race variable is from the Research Triangle Institute (RTI) race code — which more accurately captures the proportion of Hispanics and Asians.
Chart Date: April 2023
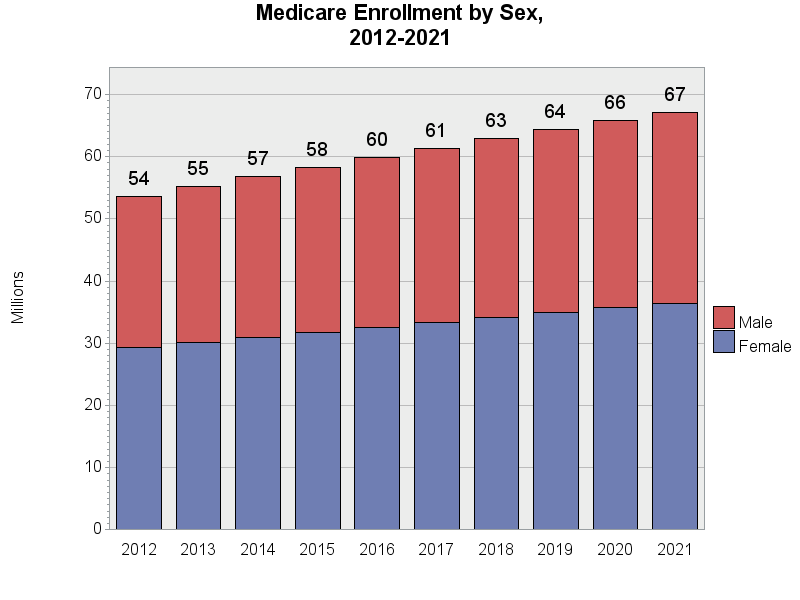
Medicare Enrollment by Sex, 2012–2021
Description:
The distribution of Medicare beneficiaries by sex has remained stable over time, with between 54–55% of beneficiaries classified as female.
Technical Notes:
Counts include all Medicare beneficiaries who were enrolled in Medicare on or after January 1 of the year.
Chart Date: April 2023
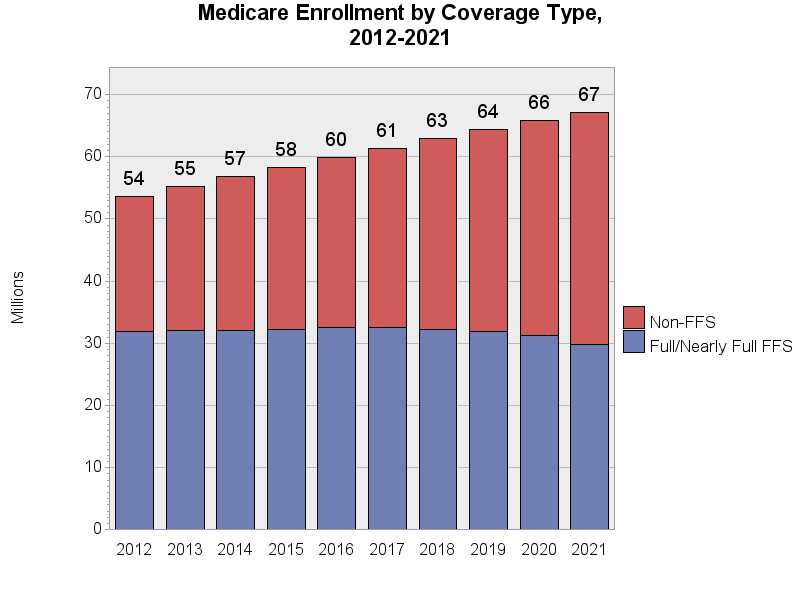
Medicare Enrollment by Coverage Type, 2012–2021
Description:
The proportion of beneficiaries with a full year of fee-for-service (FFS) coverage (11 or 12 months) decreased from 59.6% in 2012 to 44.4% in 2021.
Technical Notes:
Counts include all Medicare beneficiaries who were enrolled in Medicare on or after January 1 of the year.
Full or nearly full FFS indicates the beneficiary had 11 or 12 months of both Part A and Part B fee-for service coverage, or for persons who died during the year, from January 1 until date of death. Non-FFS indicates the beneficiary had less than 11 months of Part A and Part B FFS coverage; this category also includes people with more than one month of health maintenance organization (HMO) coverage. Some FFS beneficiaries are participants in case or disease management demonstration projects (effective 2005 forward). These beneficiaries are not considered to have HMO coverage during these months.
Chart Date: April 2023
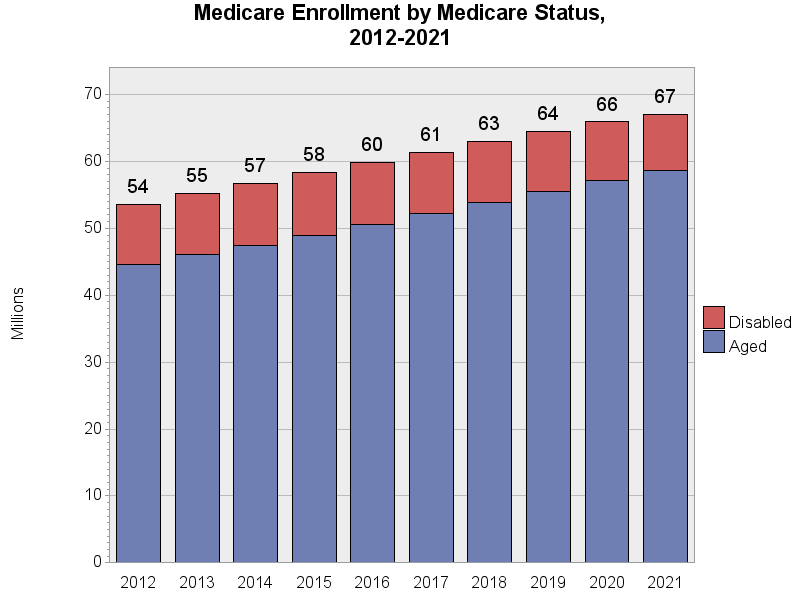
Medicare Enrollment by Medicare Status, 2012–2021
Description:
The proportion of beneficiaries classified as Disabled has decreased slightly over time. There are proportionately fewer beneficiaries classified as Disabled in 2021 (12.6%), compared to 2012 (16.8%).
Technical Notes:
Counts include all Medicare beneficiaries who were enrolled in Medicare on or after January 1 of the year.
Classification used the Medicare status code, and combined end-stage renal disease (ESRD) and Disabled categories into the “Disabled” grouping.
Chart Date: April 2023
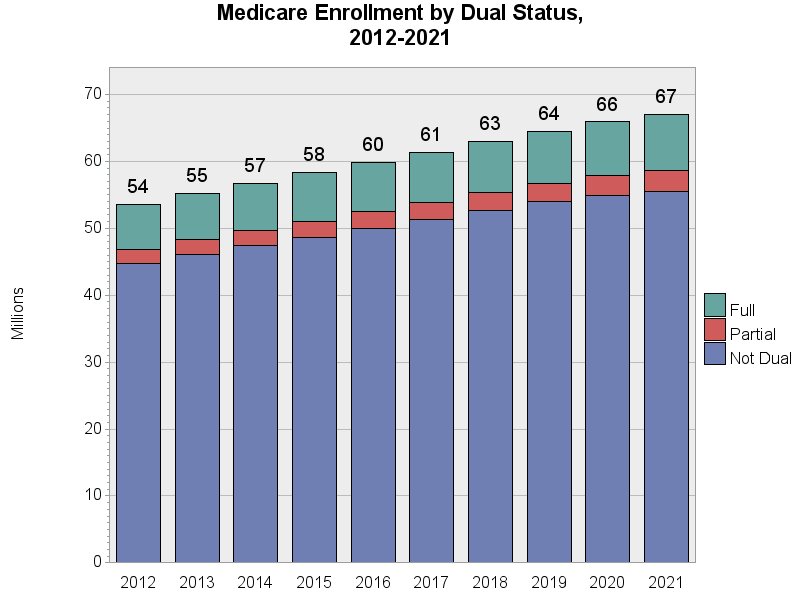
Medicare Enrollment by Dual Status, 2012–2021
Description:
The proportion of beneficiaries classified as dually enrolled in Medicare and Medicaid was stable over time through 2020 (16.5% in 2012 and 16.6% in 2020). In 2021, 17.2% of Medicare beneficiaries were dually enrolled. The proportion eligible for full dual benefits was stable over time (12.4% in 2012 to 12.5% in 2021), while the proportion eligible for partial dual benefits has increased slightly from 4.1% in 2012 to 4.8% in 2021.
Technical Notes:
Counts include all Medicare beneficiaries who were enrolled in Medicare on or after January 1 of the year.
Classification used the state-reported dual status code (variable called DUAL_STUS_CD_MM) to identify beneficiaries dually enrolled in Medicare and Medicaid. Dual coverage was defined as DUAL_STUS_CD_MM = 01, 02, 03, 04, 05, 06 or 08 for 11 or 12 months of the year, or until time of death. A beneficiary was considered a full benefit dual if they had DUAL_STUS_CD_MM = 02, 04 or 08 for a minimum of one month during the year. All other dual enrollment was considered partial.
Chart Date: April 2023
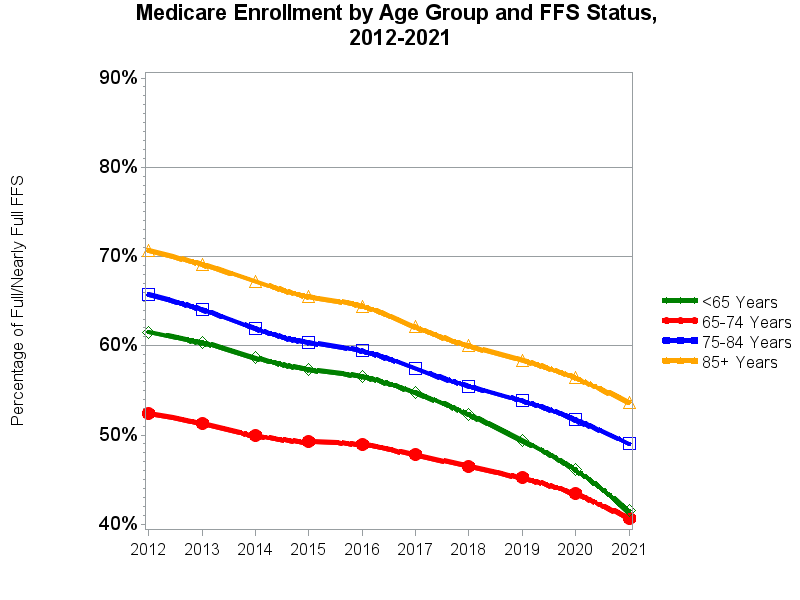
Medicare Enrollment by Age Group and FFS Status, 2012–2021
Description:
Historically, the majority of Medicare beneficiaries enrolled in fee-for-service (FFS) rather than managed care (i.e., Medicare Advantage [MA] plans) coverage. Beginning in 2007, there is a shift away from FFS, and by 2021, 44.4% of beneficiaries were enrolled in FFS for 11 or 12 months of the year.
Medicare enrollees who were 65–74 years of age were the least likely group to select FFS Medicare. By 2021, the proportion of beneficiaries 65–74 years old who were FFS for 11 or 12 months of the year declined to 41%. Medicare beneficiaries less than 65 years of age were much less likely to enroll in FFS in 2021 (41%) compared to 2012 (62% were FFS).
Technical Notes:
Counts include all Medicare beneficiaries who were enrolled in Medicare on or after January 1 of the year.
Full or nearly full FFS indicates the beneficiary had 11 or 12 months of both Part A and Part B fee-for service coverage, or for persons who died during the year, from January 1 until date of death. Non-FFS indicates the beneficiary had less than 11 months of Part A and Part B FFS coverage and includes people with more than one month of health maintenance organization (HMO) coverage. Some FFS beneficiaries are participants in case or disease management demonstration projects (effective 2005 forward). These beneficiaries are not considered to have HMO coverage during these months.
Chart Date: April 2023
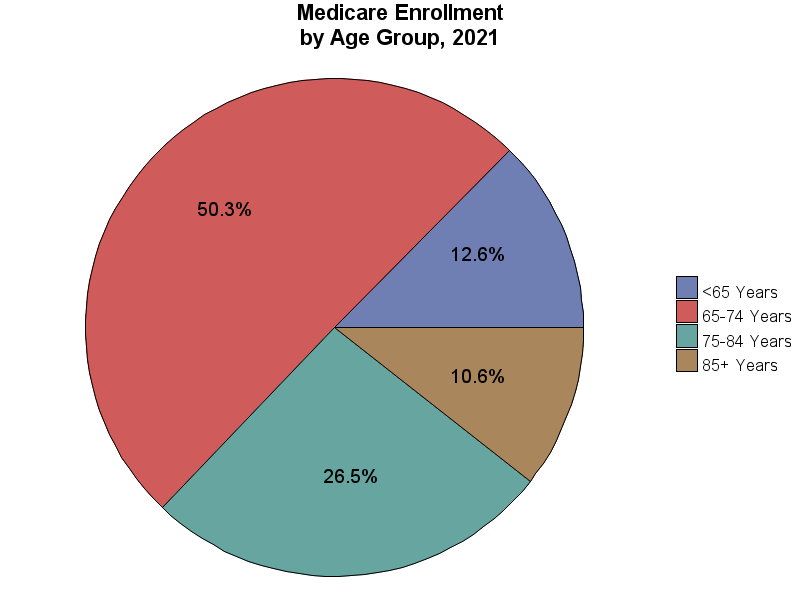
Medicare Enrollment by Age Group, 2021
Description:
The population aged 65–74 years comprises the largest age grouping for beneficiaries (50.3% of all beneficiaries).
Technical Notes:
Counts include all Medicare beneficiaries who were enrolled in Medicare on or after January 1 of the year.
Age is calculated based on the age of the Medicare beneficiary as of December 31. If the beneficiary expired, the age is calculated based on age at time of death.
Chart Date: April 2023
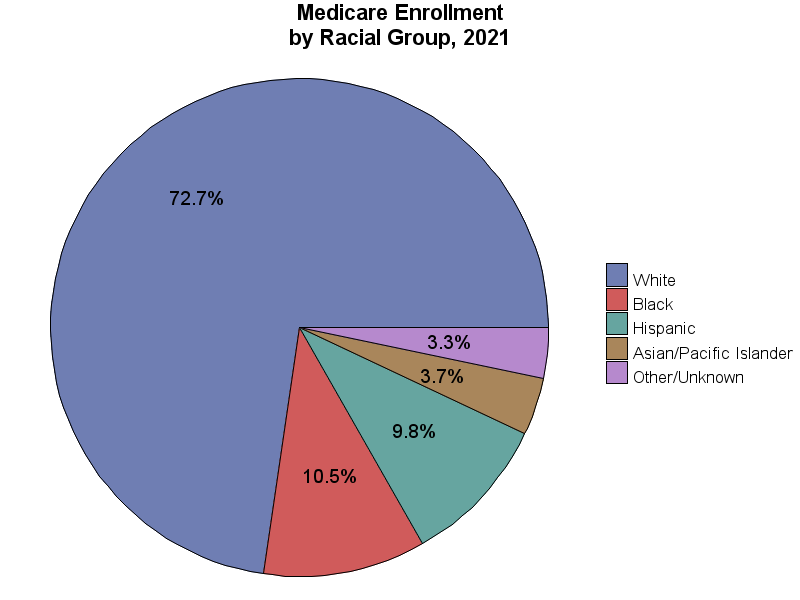
Medicare Enrollment by Racial Group, 2021
Description:
The white racial group comprises the largest proportion of beneficiaries, by racial group (72.7% of beneficiaries).
Technical Notes:
Counts include all Medicare beneficiaries who were enrolled in Medicare on or after January 1 of the year.
American Indian, Native American, Other, and Unknown races are grouped together due to small cell sizes. The race variable is from the Research Triangle Institute (RTI) race code, which more accurately captures the proportion of Hispanics and Asians.
Chart Date: April 2023
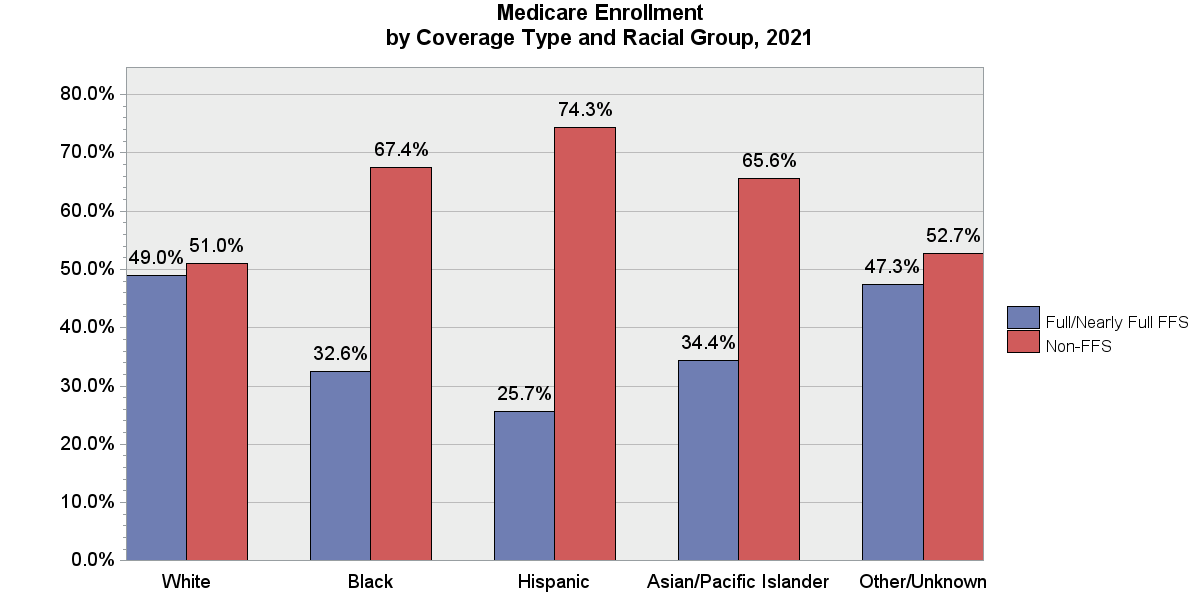
Medicare Enrollment by Coverage Type and Racial Group, 2021
Description:
In 2021, all racial groups had a higher proportion of beneficiaries with non- fee-for-service (FFS) coverage than full/nearly full FFS coverage. The racial group with the highest proportion of beneficiaries with full/nearly full FFS coverage was white (49%). In the black racial group, 32.6% were enrolled in FFS for 11 or 12 months of the year, and only 25.7% of Hispanics were enrolled in FFS.
Technical Notes:
Counts include all Medicare beneficiaries who were enrolled in Medicare on or after January 1 of the year.
Full or nearly full fee-for-service (FFS) indicates the beneficiary had 11 or 12 months of both Part A and Part B FFS coverage, or for persons who died during the year, from January 1 until date of death. Non-FFS indicates the beneficiary had less than 11 months of Part A and Part B FFS coverage and includes people with more than one month of health maintenance organization (HMO) coverage. Some FFS beneficiaries are participants in case or disease management demonstration projects. These beneficiaries are not considered to have HMO coverage during these months.
American Indian, Native American, Other, and Unknown races are grouped together due to small cell sizes. The race variable is from the Research Triangle Institute (RTI) race code, which more accurately captures the proportion of Hispanics and Asians.
Chart Date: April 2023
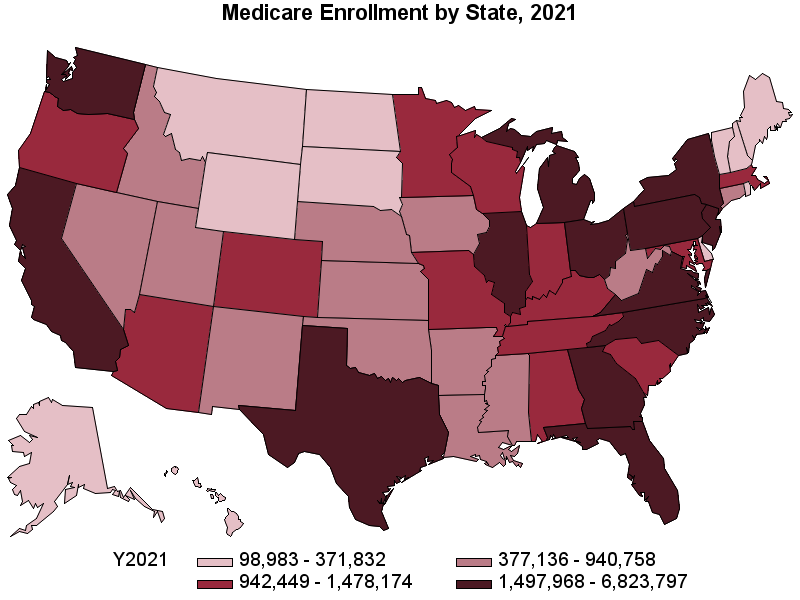
Medicare Enrollment by State, 2021
Description:
The number of people enrolled in Medicare varied by state. There were a total of 67 million Medicare beneficiaries in 2021. Washington, D.C. had the smallest number of beneficiaries (98,983), and California had the largest (6,823,797).
Technical Notes:
Counts include all Medicare beneficiaries who were enrolled in Medicare on or after January 1 of the year.
Chart Date: April 2023